
Warrington's average home hit a record £259,398 in June, up 6.5% in a year: the 39th fastest rise of 295 English districts, and ahead of the North West.
The average Warrington home was worth £259,398 in June, the highest figure the official index has ever recorded for the borough. Prices rose 6.5% over the year, or £15,751. (HM Land Registry UK House Price Index, published 19 August 2026)
That is a sharp turn. In March the annual rise was 2.7%. It has more than doubled in three months, and the single month from May to June added 1.9%.
What the index says
For Warrington borough in June 2026:
- average price £259,398, up 6.5% on June 2025 and 1.9% on May
- detached £445,181, up 4.9%
- semi-detached £269,155, up 7.3%
- terraced £207,190, up 7.6%
- flats £136,251, up 3.8%
- first-time buyer average £216,088, up 7.1%, or £14,403 in a year
The growth is in ordinary family housing rather than at the top or the bottom. Terraces and semis are rising fastest. Flats, at just over half the price of a semi, are the laggard again.
Warrington against everywhere else
England as a whole rose 1.8% over the year, to an average of £293,262. The North West rose 4.7%, to £219,922. Warrington is running well ahead of both.
Ranked against all 295 English local authority districts on annual change, Warrington comes 39th. Sixty-two of those districts saw prices fall over the year.
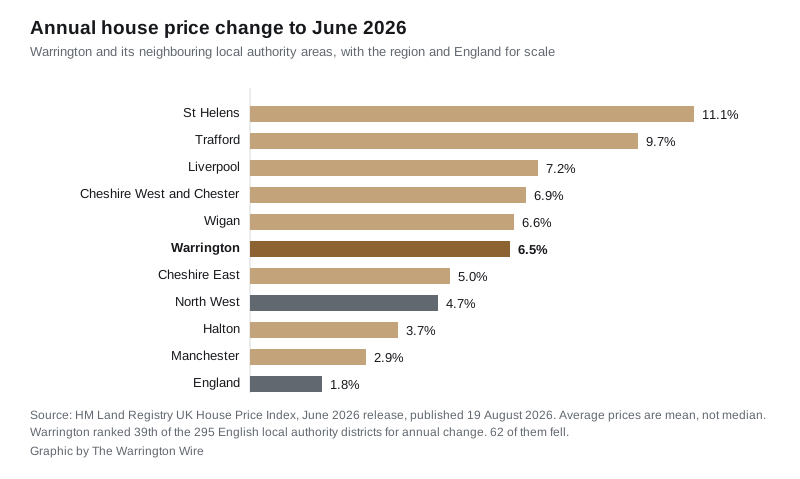
Locally, Warrington is quick but not the quickest. St Helens, next door, rose 11.1% and came fourth in England. Trafford rose 9.7%. Cheshire West and Chester managed 6.9% and Wigan 6.6%, both a shade ahead of Warrington.
On the other side, Halton rose 3.7%, Cheshire East 5.0% and Manchester 2.9%.
Price levels are a different ranking. Warrington’s £259,398 sits above Wigan (£195,557), St Helens (£186,435) and Halton (£193,134), and below Cheshire East (£303,387), Stockport (£314,495) and Trafford (£396,811).
Two things to hold on to
This is a mean, not a median. The UK House Price Index averages every recorded sale, so a handful of large sales in Lymm or Appleton pull the borough figure up in a way a middle-of-the-pack sale price would not. Our ward-by-ward page uses medians from completed Land Registry sales, which is why its borough figure is lower.
The index revises itself every month. May was first published at £253,937 and an annual rise of 4.3%. In the June release the same month reads £254,466 and 4.5%. Revisions are usually small, but they can move the direction of a headline, so the newest month is always the least settled one.
The market is thinner than the prices suggest
Sales volumes lag the price data by about two months, so the most recent publishable count for Warrington is April 2026, at 156 sales. March was 184 and February 206.
Comparing that with last spring is a trap worth naming. Warrington recorded 491 sales in March 2025 and 128 in April 2025, either side of the stamp duty threshold change on 1 April that year. Buyers rushed to complete before it. Any “sales have collapsed since last March” line is measuring that rush, not this market.
What it means for you
If you are selling, the borough figure is not your valuation. The gap between a Fairfield terrace and an Appleton detached in Warrington is wider than three to one, and the borough average moves with the mix of what sold that month.
If you are buying with a mortgage, the first-time buyer average of £216,088 is up £14,403 on a year ago. On a 10% deposit that is roughly £1,440 more to save than the same buyer needed last June.
If you are checking your council tax band, none of this changes it. Bands are still set on what a property was worth on 1 April 1991, not on today’s price. Our Warrington council tax bands page sets out the 2026/27 charge for each band and parish.
For the detail underneath the borough number, including the median sale price in each of Warrington’s wards, see our Warrington house prices page.
Sources
- HM Land Registry: UK House Price Index for June 2026, published 19 August 2026
- UK House Price Index full data file, June 2026 release, area code E06000007 and all 295 English local authority districts
- UK House Price Index, Warrington
Have your say