
Warrington's average home reached a record £260,040 in July, up 5.4% in a year. That is the 33rd fastest rise of 295 English districts, while 85 districts fell.
The average Warrington home was worth £260,040 in July, the highest figure in the whole run of the official index. Prices rose 5.4% over the year, or £13,240.
That is according to the UK House Price Index for July 2026, published by HM Land Registry on 16 September.
The number worth holding on to is not the record. It is the gap between Warrington and the country. England as a whole rose 1.1% in the same twelve months. Warrington rose almost five times as fast.
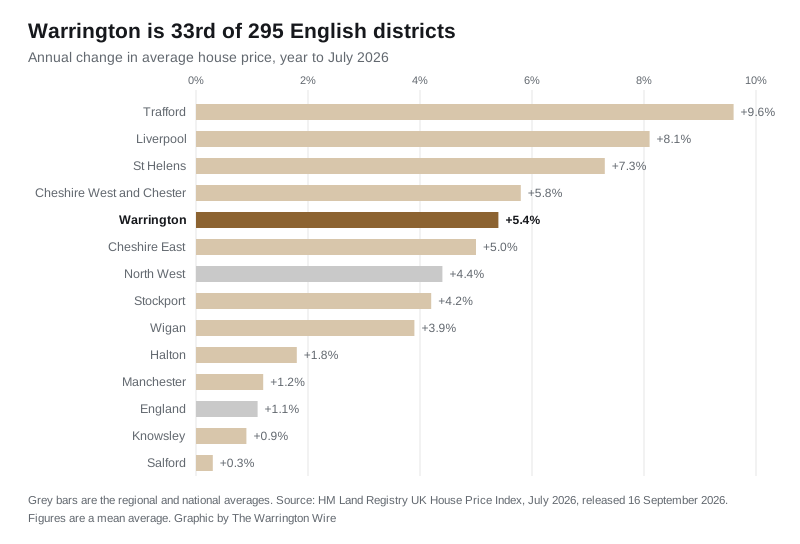
Warrington is 33rd of 295
We ranked every English local authority district in the index on its annual change. Warrington came 33rd of 295. In the same month, 85 of those 295 districts recorded a fall.
So this is not a national picture that Warrington happens to sit in. Across England the market is split roughly seven ways up and three ways down, and Warrington is in the top ninth of the risers.
The North West is a large part of the reason. Six of England’s eight fastest risers in July were North West or Lancashire districts:
- Trafford, up 9.6%, the fastest in England
- Burnley, up 8.6%
- Hyndburn, up 8.5%
- Pendle, up 8.3%
- Liverpool, up 8.1%
- Westmorland and Furness, up 7.7%
Against its immediate neighbours, Warrington is a solid middle. Trafford (£400,688, +9.6%) and Liverpool (£189,036, +8.1%) are well ahead. So are St Helens (£185,154, +7.3%) and Cheshire West and Chester (£270,104, +5.8%). Behind Warrington come Cheshire East (£309,121, +5.0%), Stockport (£317,913, +4.2%), Wigan (£194,551, +3.9%), Halton (£194,727, +1.8%), Manchester (£252,309, +1.2%), Knowsley (£188,527, +0.9%) and Salford (£229,462, +0.3%).
The North West average was £221,445, up 4.4%. The England average was £293,479, up 1.1%. Warrington sits above its region on price and well above it on growth, and below England on price.
What rose and what did not
By property type, in July 2026:
| Type | Average | Annual change |
|---|---|---|
| Detached | £445,962 | +4.6% |
| Semi-detached | £269,832 | +6.2% |
| Terraced | £208,101 | +6.1% |
| Flat | £136,157 | +2.0% |
| First-time buyer | £216,562 | +5.7% |
| Former owner-occupier | £313,707 | +5.1% |
Flats are the outlier, and have been for some time. At +2.0% they rose barely a third as fast as semis, and a Warrington flat is now worth less than a third of a Warrington detached house.
The first-time buyer average of £216,562 is up £11,700 on the year. On a 10% deposit that is roughly £1,170 more to save than a year ago, before any change in mortgage rates.
A correction on last month’s figure
When we reported the June index in August, the average stood at £259,398 and the annual rise at 6.5%. Both numbers have since been revised. June now reads £258,514 and +6.1% in the same official series.
That is normal. The Land Registry revises recent months as more completed sales are registered, and it is why a single month’s figure should never be read as precise. We are noting it because we published the earlier number.
Read against the revised figure, July’s rise of 5.4% is a second consecutive month of slower annual growth, from 6.1% in June. Prices are still at a record; the rate at which they are climbing has eased.
The figure is a mean, not a median
The UK House Price Index average is a mean, and it is modelled rather than a raw count of what sold. A handful of expensive sales pull it up in a way that a median would not. Our Warrington house prices page uses the Land Registry median sale price instead, which is why it shows a lower figure, and breaks it down ward by ward.
Sales volumes lag the price data by about two months. The most recent publishable count is May 2026, at 186 sales, against 195 in May 2025.
One warning on sales comparisons: do not compare across spring 2025. The stamp duty threshold changed on 1 April that year, and Warrington recorded 491 completed sales in March 2025 against 128 in April 2025. The equivalent months in 2026 were 211 and 170.
What it means for you
If you are selling. Your asking price is not the index. The index is a borough-wide modelled mean covering Lymm and Latchford alike, and Warrington’s ward medians range from about £450,000 in Appleton to £140,000 in Fairfield and Howley. Use the ward figure, not the headline.
If you are buying. The borough is still rising faster than England, but the pace has come off for two months running. Semis and terraces are where the movement is; flats have been close to flat for a year.
If you are a first-time buyer. The FTB average of £216,562 sits comfortably below the £300,000 at which first-time buyer stamp duty relief runs out, so a typical Warrington first purchase attracts no stamp duty. A detached house at the borough average of £445,962 does. Check the council tax band before you commit: the band D charge varies by more than £120 a year between Warrington’s parishes.
If you are remortgaging. A 5.4% annual rise moves some owners into a better loan-to-value bracket. It is worth re-checking your band before your fixed rate ends.
Where these figures come from
Every figure above is from the HM Land Registry UK House Price Index for July 2026, released on 16 September 2026. The ranking of 295 English districts, the neighbour comparisons and the sales volumes are our own calculations from the index’s full data file, which carries every local authority for every month. Warrington’s area code in the index is E06000007.
The index is published under the Open Government Licence.
Have your say