
3,640 Warrington residents claimed out-of-work benefits in October, up 290 in a year and level with the highest since June 2022. September was revised down.
3,640 people in Warrington borough were claiming unemployment-related benefits in October. That is up 35 on September and up 290 on October 2025.
The count has not been higher since June 2022, when it stood at 3,700. It matches August 2024, the only other month since then to reach 3,640.
The figures come from the ONS claimant count, published through nomis on 17 November. They count people claiming Universal Credit or Jobseeker’s Allowance mainly because they are out of work.
- 3,640 claimants in October, up 35 on September and up 290 on a year ago
- a rise of 8.7% in a year, against 4.6% across the North West and 3.3% in England
- 2.7% of residents aged 16 to 64, against 4.2% in the North West and 4.1% in England
- 840 claimants aged 16 to 24, down 20 on September but up 95 on a year ago
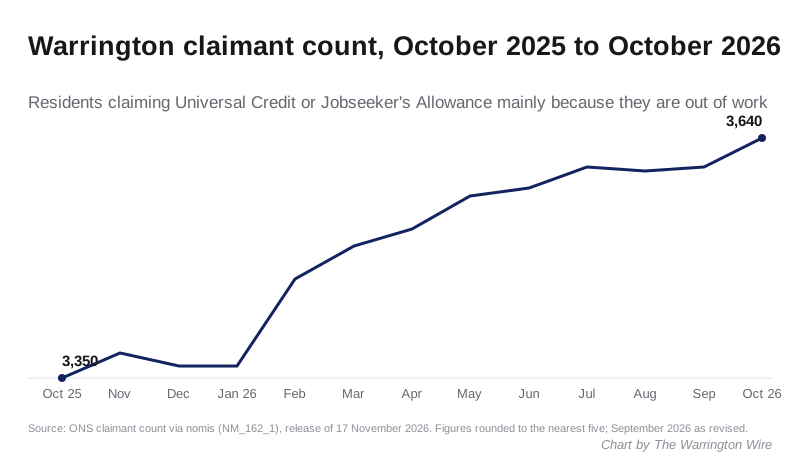
September was revised down
Last month we reported a September count of 3,665, with 875 under-25s. This release revises September to 3,605, and the under-25 figure to 860. The ONS allows the Universal Credit part of the count to be revised for one previous month.
The revision matters for our September headline. On the revised figure, September was level with July and below August 2024, so it was not the highest count since June 2022. We have added a correction to that story.
The month-by-month picture is now a slow climb through 2026, with a pause in the summer:
| Month | Claimants |
|---|---|
| January 2026 | 3,365 |
| April 2026 | 3,530 |
| July 2026 | 3,605 |
| August 2026 | 3,600 |
| September 2026 (revised) | 3,605 |
| October 2026 | 3,640 |
Every age group is up on a year ago
The under-25 count fell back slightly from September, but it is still well up on last year. October’s 840 matches October 2021 and is the highest October figure since then.
| Age | October 2025 | October 2026 | Change |
|---|---|---|---|
| 16 to 24 | 745 | 840 | +95 (12.8%) |
| 25 to 49 | 1,905 | 2,030 | +125 (6.6%) |
| 50 and over | 700 | 765 | +65 (9.3%) |
Across the North West, under-25 claimants rose by 10.1% over the same year, from 41,170 to 45,310.
Low rate, sixth-fastest rise in the region
Warrington’s rate of 2.7% is still low for the North West. Six of the region’s 35 local authority areas are lower, and Cheshire West and Chester and Fylde are level. Ribble Valley and Westmorland and Furness are lowest at 1.8%. Oldham is highest at 6.7%.
Warrington’s 8.7% rise is the sixth largest of the 35. Wyre (18.6%), Cheshire East (11.7%), Blackburn with Darwen (10.5%), Ribble Valley (9.6%) and Chorley (9.4%) rose faster. Westmorland and Furness was the only area where the count fell.
Among the neighbours:
| Area | Rate, October 2026 | Change on a year |
|---|---|---|
| Cheshire East | 2.4% | +11.7% |
| Cheshire West and Chester | 2.7% | +7.6% |
| Warrington | 2.7% | +8.7% |
| Trafford | 3.0% | +3.9% |
| Wigan | 3.6% | +3.8% |
| St Helens | 3.8% | +1.4% |
| Halton | 4.3% | +4.0% |
What this figure is, and what it is not
The claimant count is not the unemployment rate. The ONS says it counts people claiming benefits mainly because they are unemployed. Under Universal Credit that includes some people in low-paid work who are still required to look for more.
Local figures are rounded to the nearest five. October’s figure can itself be revised once, when the November count is published in December.
What it means for you
If you are out of work, or working and still short of money, there is local help before things reach a crisis.
- The council’s Crisis and Resilience Fund can make crisis payments and housing payments. We have set out who runs it and what you can apply for.
- Citizens Advice Warrington runs a drop-in at The Gateway, 89 Sankey Street, listed on its own website.
Sources: ONS claimant count, October 2026 release, via nomis (dataset NM_162_1: Warrington E06000007, North West E12000002, England E92000001, and the 35 North West local authorities); ONS Claimant Count Quality and Methodology Information.
Have your say